Revenue and Charges Charts
The Revenue bar graph and pie chart show a daily calculation of account revenue performance for specific time-frame. Revenue is defined as the total account revenues earned by the SIMs in the selected sub accounts for a defined length of time.
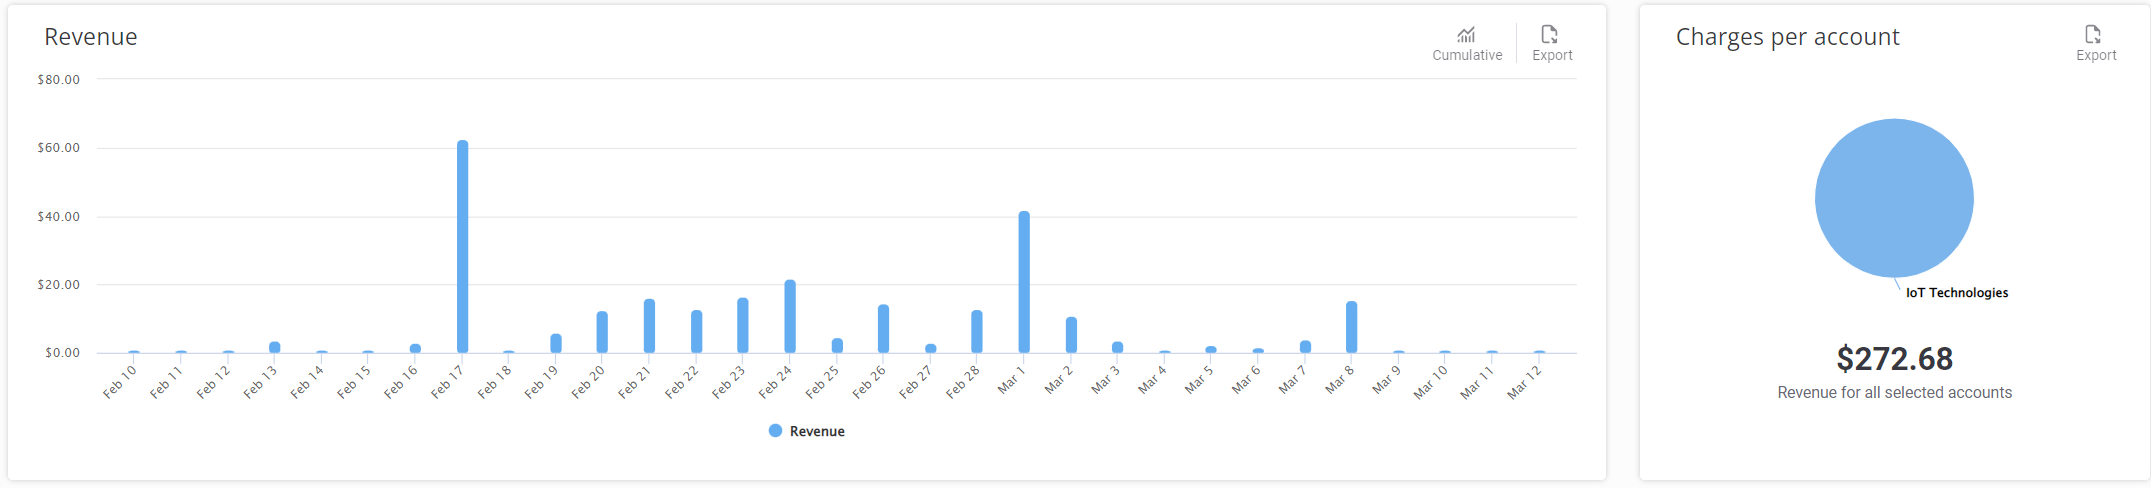
Here is an example of the Revenue bar graph and pie chart over the selected time period:
A description of the key elements is provided in this table.
| Attribute | Description |
|---|---|
| Export | Click to Export as CSV file. |
| Tooltips | Hover over each bar in the bar graph to see the amount. |