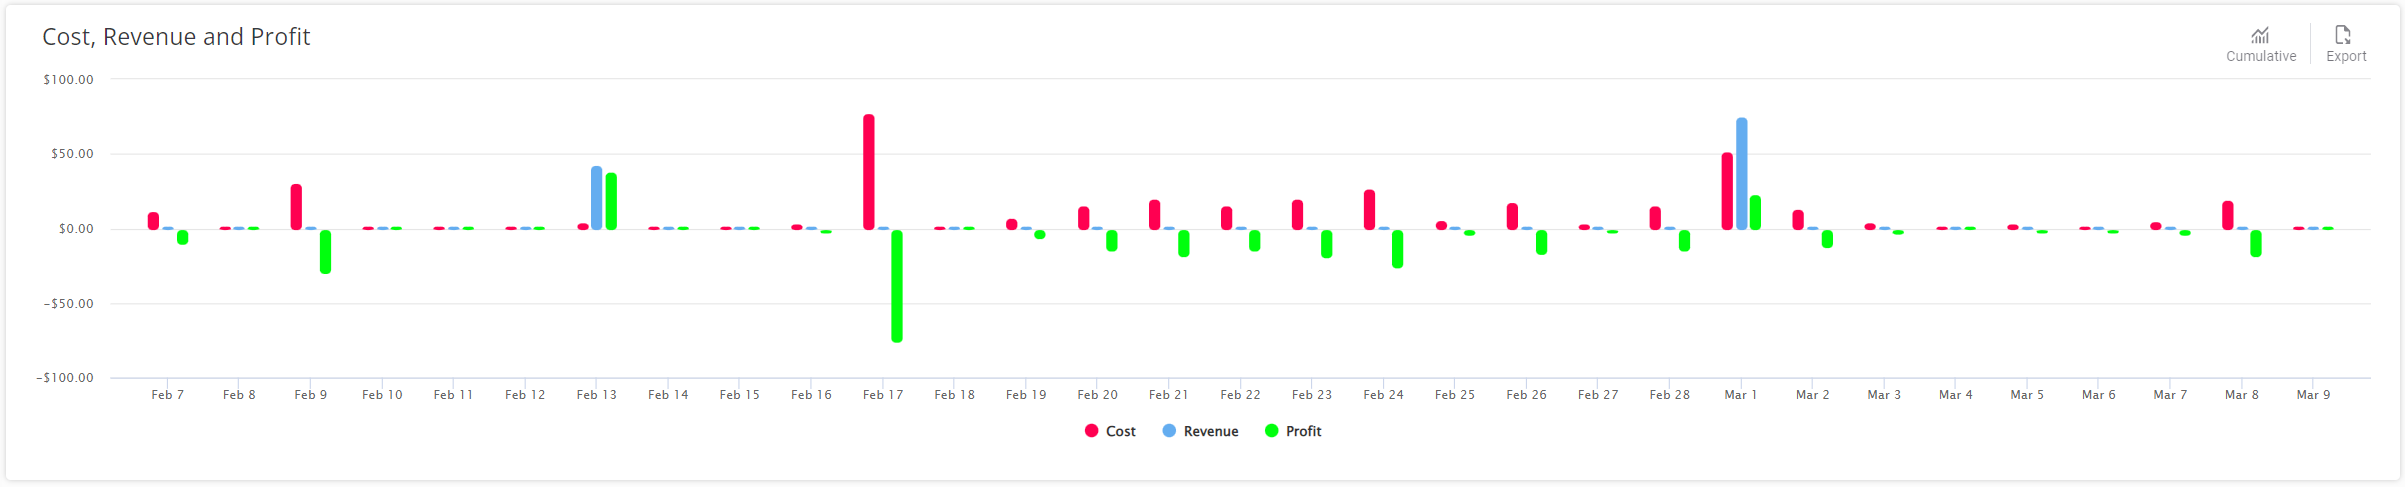
Cost Revenue and Profit Chart
The Cost Revenue and Profit shows a calculation of account economic performance indicators. The indicators are color-coded as follows:
| Color | Indicator | Description |
|---|---|---|

|
Cost | The total cost incurred by all SIMs in your account for a specified duration of time. This is the amount of money you must pay to your Parent account |

|
Revenue |
The total account revenues earned by the SIMs in your sub accounts for a specified duration of time. |

|
Profit | Calculated as Revenue minus Cost for a specified duration of time. |
An example of the Cost Revenue and Profit chart is shown here.
A description of the chart options is provided in this table.
| Attribute | Description |
|---|---|
| Export | Click to Export as CSV file. |
| Tooltips | Hover over each bar in the bar graph to see the amount. |
NOTE: When the Include Sub-Accounts option is disabled, the dashboard only displays the Cost, since your main account does not have any revenue for its SIMs.